How the 2020 Census is Targeting Hard-to-Count Populations and What We Can Learn for Energy and Utility Research
I entered a rabbit hole of survey nerdery last week after stumbling across the 2020 Census Predictive Models and Audience Segmentation Report, a 114-page propensity modeling and segmentation analysis by the U.S. Census. If you really want to geek out on survey methods, enjoy! I was actually surprised to learn how much work and analysis the Census Bureau has been doing for the last 10 years to identify areas (and populations) at risk for low responses… and strategize outreach accordingly.
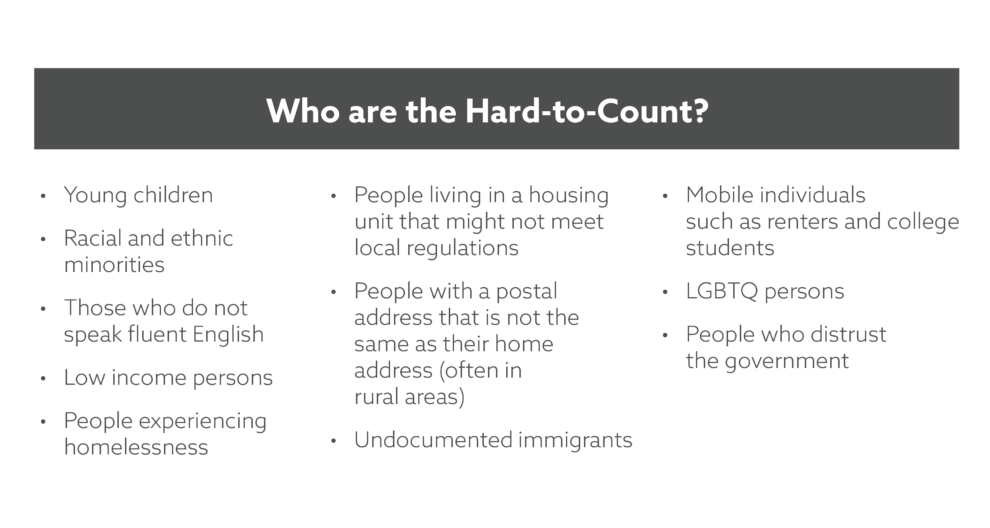
To say that the 2020 Census is controversial is an understatement. We knew as early as 2017, when the Census started pre-testing, to expect an “unprecedented groundswell in concern around confidentiality and data sharing, particularly among immigrants or those who live with immigrants.”1 But let’s not get sucked into the political rabbit hole of the citizenship question. As a researcher, what I found the most fascinating about the Census work is who’s at risk of an undercount, why, and how the Census is addressing it.
Reaching hard-to-count populations is critical to our democratic system and for the appropriation of federal dollars. In the case of energy and utility research, an accurate count is important for program marketing, education, and outreach (ME&O), understanding adoption and equity, and reaching a more representative sample in our research.
The Undercount
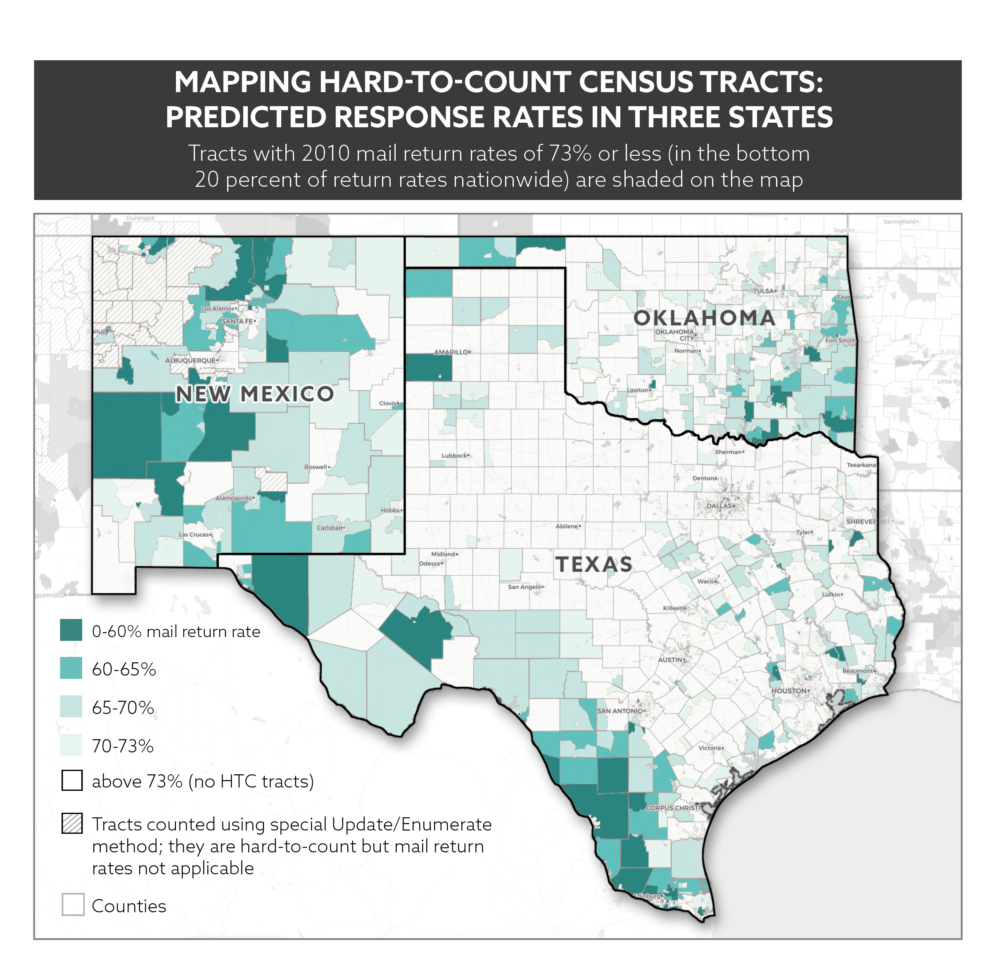
An undercount in any state has real consequences: The Center for Public Policy Priorities estimates that a 1% undercount in Texas could cost the state $300 million in federal funding each year. According to the Annie E. Casey Foundation, about 300 programs rely on data derived from the Census. Medicaid, Medicare, DOT Highway Planning and Construction, the Federal Pell Grant Program, the National School Lunch Program, Supplemental Nutrition Assistance Program (SNAP), and Section 8 Housing Choice Vouchers are among the largest programs that use Census Bureau data to distribute funds.2 For many of these programs, the intended beneficiaries are individuals who are also traditionally “Hard-to-Count.”
So how does the U.S. Census go about finding the “Hard-to-Count?” To start, a team of U.S. Census Bureau and industry statisticians predicted self-response rates for every tract and developed eight segments with shared perceptions/concerns/barriers. The analysis was informed by historical response rates as well as the 2020 Census Barriers, Attitudes, and Motivators Study, an online survey of 50,000 individuals conducted by the Census Bureau in 2018. The online survey was supplemented with qualitative focus groups to uncover knowledge and attitudes among small demographic groups and those difficult to reach online.3 Further, the analytics on predicted response rates even included two Kaggle data science competitions to crowdsource modeling…not bad, government! The result is predicted response rates and segment assignments for every census tract in the country, allowing administrators (and marketers) to rank and understand the tracts and regions most- and least-likely to respond. These insights will inform a targeted multi-media campaign and higher investment in tracts with the lowest expected response rate.
Census tracts with the highest expected response rates tend to be whiter and older, while tracts with higher proportions of Hispanic and Latino residents generally have lower predicted response rates. The Designated Market Areas (DMAs) with the top 10 highest predicted response rates are in the upper Midwest (Cedar Rapids, Iowa, tops the list). The DMAs with the lowest expected response rates are in the Southeast, Southwest, and Texas.
Some of the areas at the greatest risk for undercounts are among the largest recipients of Community Development Block Grants.4 The national average for the predicted self-response is 61%, but the average predicted response rate for census tracts with the highest concentration of Hispanic and foreign-born residents (or “Multicultural Mosaic”) is only 45%. By contrast, in “Responsive Suburbia,” home to 24% of the U.S. population, the predicted self-response rate is 71%.
Want to know how your state or community is predicted to respond? Use the Census Bureau’s Response Outreach Area Mapper (ROAM) tool to find out.
Count Me In
The “Confidentiality Minded” is the segment with relatively more Hispanic and Latino households. Compared to other segments, people in this segment believe it matters personally if they are counted in the 2020 Census and that participating in the Census could benefit their community. At the time this research was conducted (2018), people in this segment also placed higher-than-average trust in the U.S. government to “do what is right”. However, people in this segment are concerned that answers will not remain confidential, may be shared with other government agencies or used against them.
For a digestible profile of each of the Mindset segments, see pages 40-47 of the 2020 Census Predictive Models and Audience Segmentation Report.
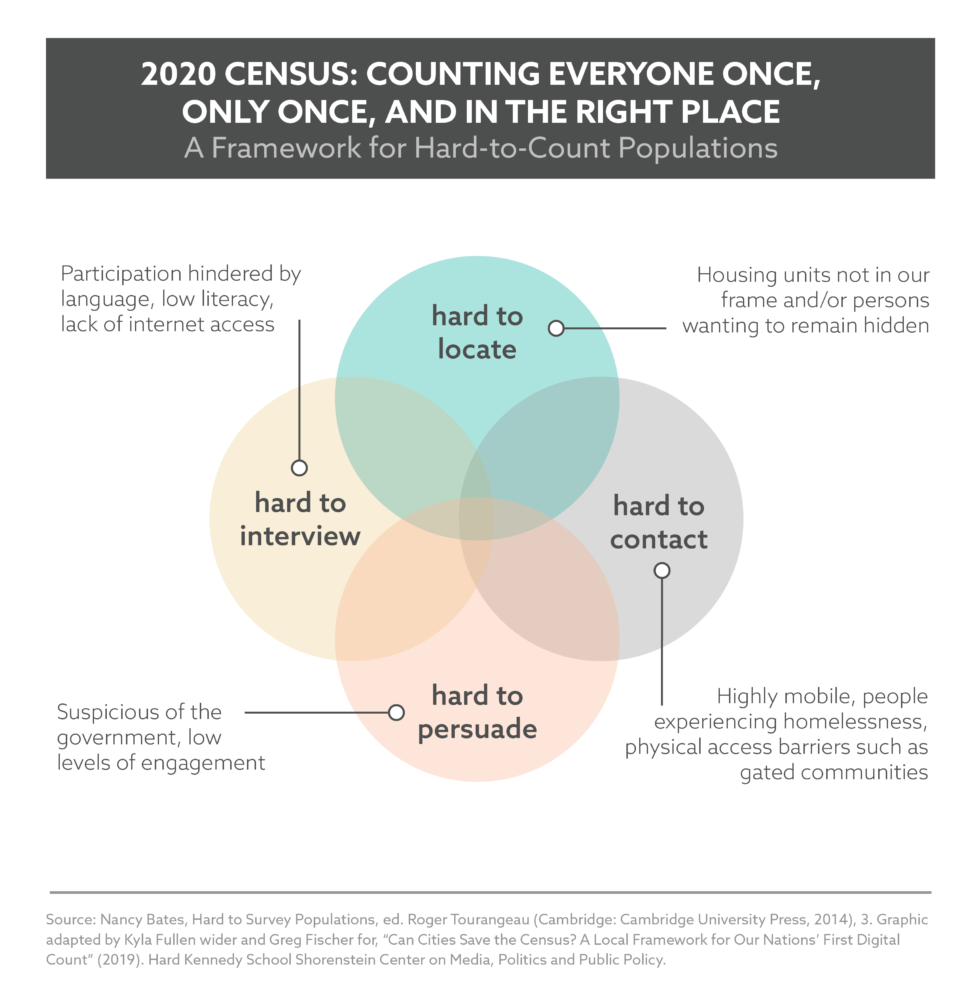
How Do We Reach the ‘Hard-to-Count’?
Historically, the Census has been administered as a paper form, delivered to every household. The 2020 Census will lead with a “push-to-web” approach, and 66% of responses are expected to come from an online form (vs. paper, phone, or in-person). For most of the country (about 80%), households will receive a letter encouraging them to go online to complete the form, with an option to complete by phone. Then all households will receive a reminder letter, and non-respondents will receive a reminder postcard followed by a paper questionnaire. Approximately 20% of the country classified as hardest to reach will receive the paper questionnaire immediately, (instead of waiting for nonresponse to the push-to-web letter). After about two months, in-person outreach will commence with non-respondents. A small minority of tracts in very hard-to-count areas (sparsely populated and rural) will receive in-person outreach right away (i.e., no mail).
What Does This Mean for Energy Research?
Reaching hard-to-count populations is critical for our democratic system, for providing services, and for energy and utility research, where equity is becoming an increasing concern. Several states have built equity mandates and goals into their energy efficiency and renewable energy plans and legislation. For example, the New York State Climate Leadership and Community Protection Act establishes a goal that disadvantaged communities should receive 40% of overall benefits of spending on clean energy and energy efficiency programs, projects, or investments.6 Energy Trust of Oregon developed a Diversity, Equity and Inclusion Operations Plan in 2018 with 10 goals, including increasing customer participation in energy efficiency and renewable energy programs for all underserved populations by 2020—a two-year time frame for a 20% increase.7 The Massachusetts Program Administrators have been designing programs and outreach to serve more moderate-income and limited English proficiency households for many years, and “are amplifying efforts to serve all customers, including moderate income customers.” The Plan will offer enhanced strategies and community outreach efforts targeting renters, moderate income customers, and non-English speaking customers.”8
With Great Data Comes Great Responsibility
ILLUME has been using insights from the U.S. Census Bureau’s research among Hard-to-Count populations, and their 2020 Census recruitment approach, to inform large-scale general population and nonparticipant surveys. We recently launched a large-scale, multi-mode statewide nonparticipant study designed to improve coverage among low-to-moderate income, limited English proficiency, and renter households. Similar to the 2020 Census approach, we developed a series of mail (with push-to-web) and email communications and reminders, with a follow-up strategy for non-respondents. In another state, we are creating interactive maps of energy efficiency program participation and Census data to see how participation relates to several indicators of diversity (e.g., own/rent, energy bills, LIHEAP), and identify gaps or hard-to-reach communities that could use extra investment or targeting. We can also imagine extending this research to propensity models or “barriers” to understand relationships between household characteristics, and finding hard-to-reach areas on multiple dimensions.
Can those of us who rely on Census data (or simply like the idea of everyone being counted and represented…) do more to eliminate barriers for folks to participate and be counted? Though many states have passed bills or approved spending to encourage participation, some states like Texas, Florida, Mississippi, and Louisiana—with relatively lower predicted response rates—have yet to take action. After writing to your representatives, check out if there are “Local Complete Count Committees” near you. These are grassroots efforts to spread the word about the importance of the 2020 Census in communities or special population groups. If we are serious about democracy and about addressing issues of equity in energy, then regulators and industry leaders have a once-in-a-decade opportunity to educate legislators to ensure the Census is a mirror image of the people we serve.
Here’s to hoping that we can come together to support the Census so that everyone can “stand up and be counted!”