
Our Work
News & Insights
More ILLUME News & Insights posts are coming soon – including a special Archived Insights section with resources from ILLUME’s first decade. Sign up for our e-newsletter today to stay current on all things ILLUME.
-
Podcasts
Good rate design is more than engineering—it takes trust, equity, and understanding. In this episode, ILLUME’s Liz Kelley and…
-
Case Studies
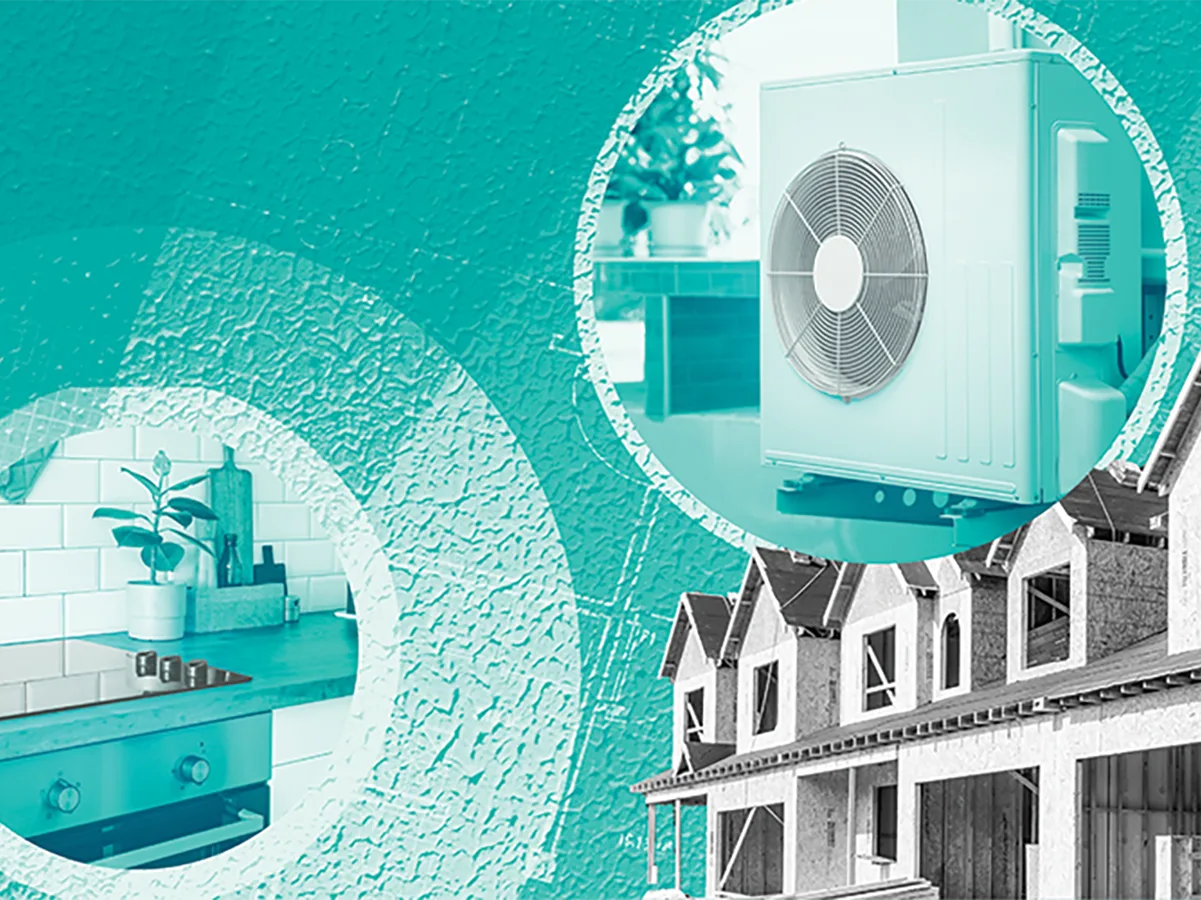
By integrating customer insights and system performance data, ILLUME helped Georgia Power uncover how installation practices determine whether inverter-driven…
-
Articles
At ILLUME, many of us have built our careers around energy efficiency. For some, like our Co-Founder Sara Conzemius,…
-
Podcasts
In this episode, ILLUME’s Pace Goodman talks with Mark Milby of Elevate and Steven LaBarge of ComEd about what…
-
Articles
Meeting the Moment We’re In Across the country, utilities are navigating a convergence of pressures—rising temperatures, escalating energy costs,…
-
News
The move represents a substantial stride in the company’s vision to be the utility industry’s solution partner of choice.…
-
Podcasts
In this candid and thoughtful conversation, Anne Dougherty sits down with two of ILLUME’s newest consultants, Maggie Roma and…
-
Articles
Thank you for joining us for the second session in our ongoing webinar series on the evolving energy landscape…
-
Articles
In today’s global and national economy, businesses—especially those in capital-intensive industries like energy, infrastructure, and transportation—thrive on stability, predictability,…
-
Webinars
We are excited to share with you an exclusive, ChangeMaker Q&A session featuring legal experts from Van Ness Feldman…
-
Articles
There is no question we are living through an extraordinary moment. Every day, a new institution—built over decades—is being…
-
News
We pioneered human-centered energy consulting. Now, we are poised to address a new era of energy transformation. After over…
-
White Papers
In this paper, written for ACEEE Summer Study 2024, we share promising practices around how jurisdictions can approach measuring…
-

White Papers
Engaging with Customers in Their Preferred Language
White Papers
This paper, written for ACEEE Summer Study 2024, will share the results of an expansive study focused on language-focused…
-
White Papers
This white paper references research done for leading utilities across the U.S., highlighting the approaches and course corrections pioneering…
-
Case Studies
ILLUME conducted an ethnographic research study to explore the magnitude of installation challenges for heat pump water heaters (HPWHs)…
-

Articles
Understanding Home Decision-Making
Articles
Residential buildings account for approximately 20% of energy consumption in the U.S. To achieve local, state, and federal decarbonization…
-
Articles
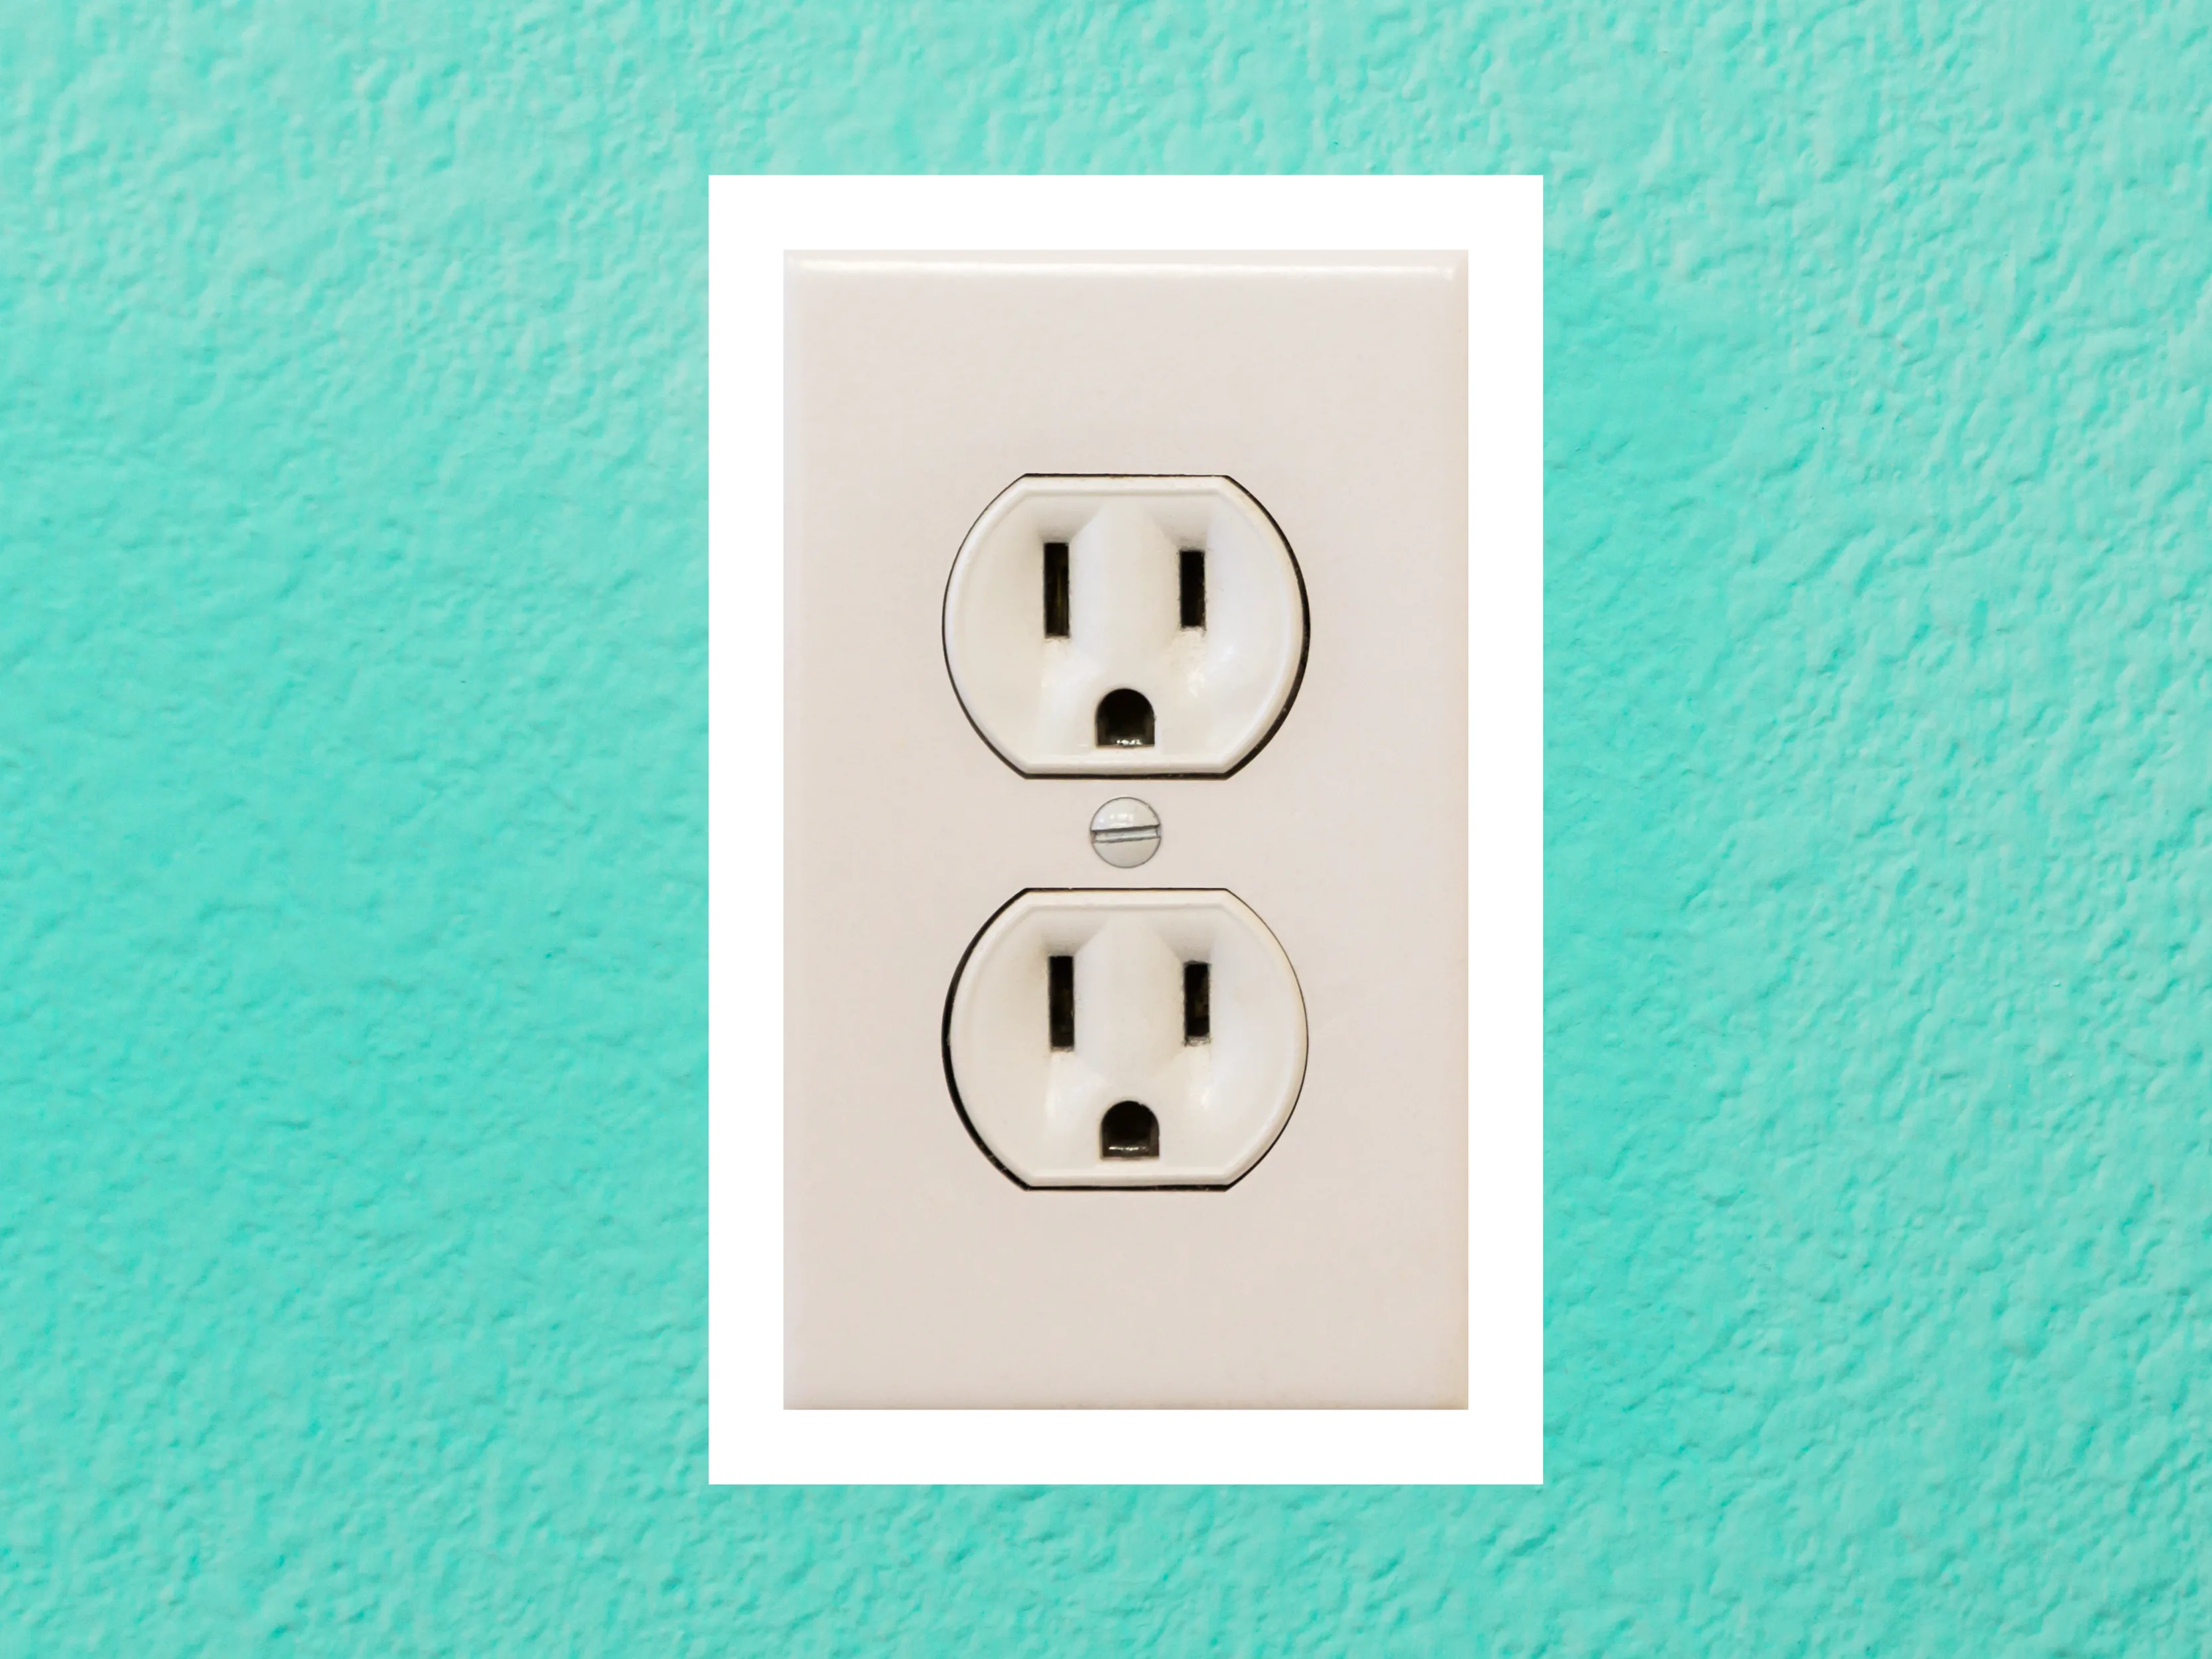
As new technologies and devices are rapidly introduced to the market, a demand response ecosystem is emerging that provides…
-
Case Studies
Rolling out dynamic pricing (or real-time pricing) rates is a challenge, but new rate designs will be increasingly necessary…
-
Presentations
This presentation shows that despite having advantages, induction cooking has only a small share of the residential cooking market.
-

Podcasts
A Tale of Two Engineers
Podcasts
In this podcast ILLUME Executive Vice President, Jes Rivas, interviews Senior Consultant and fellow Engineer, Nabila Huq. You’ll learn…
-
Case Studies
Many states, agencies, and utilities are entrusted with translating policies and goals into actionable strategies. In this case study,…
-
Articles
We are living in a moment of transition as people are interacting with the grid, their utilities, and their…
-
Magazine Articles
Volume 4: The Great Decarbonization
Magazine Articles
Our fourth volume of the ILLUME Magazine, “The Great Decarbonization,” is an inspirational collection of articles, interviews, and ideas…
-

Magazine Articles
Big Data and Small Business
Magazine Articles
Using Data-Driven Models to Reveal Energy Savings Opportunities in an Underserved Customer Segment
-

White Papers
Unlocking Just Transportation Electrification
White Papers
Unlocking Just Transportation Electrification: Addressing Barriers and Promoting Access
-

Case Studies
Testing the Efficacy of Home Energy Reports
Case Studies
Drawing on statistical methods from biomedical research, ILLUME applied meta-analysis techniques to measure savings from home energy report (HER)…
-

Case Studies
Connecting with Communities
Case Studies
Expanding engagement to create more inclusive programs. With a novel and engaging research approach, ILLUME identified strategies for an…
-

White Papers
Tunnel Vision
White Papers
The Impact of Ignoring Behavior in Technological Innovation. In this white paper presented at the ACEEE Summer Study 2022…
-
Reports
In this evaluation of the Solar on Multifamily Affordable Housing (SOMAH) Program for San Diego Gas and Electric (SDG&E)…
-
Reports
ILLUME led the process evaluation and longitudinal market study of changes in EV awareness and adoption in National Grid’s…
-
Spark
Detailed ILSFA Metrics
Spark
As part of ILLUME’s mid-year report focused on the grassroots education component of ILSFA, we outlined metrics that can…
-

Podcasts
Women Leaders in Energy
Podcasts
In this episode of Current, An Energy Podcast, we talk with inspiring women leaders and business owners in Energy.…
-

Podcasts
Powering Partnerships
Podcasts
Listen to our new podcast episode where team members from ILLUME and Encolor discuss our new strategic partnership.
-

Webinars
Energy Changemakers
Webinars
Regional Energy Efficiency Organizations (REEOs) play a pivotal role in enabling energy efficiency initiatives across the United States. In…
-

Conferences
ACEEE Summer Study 2024
Conferences
Let’s Connect at ACEEE in Pacific Grove, CA, August 4-9, 2024. ILLUME will have multiple team members attending and…
-
White Papers
Code and Communities
White Papers
This paper summarizes the work the authors undertook to identify strategies and best practices to consider as part of…
-

Articles
The Impact of Mentorship
Articles
In this blog series, we sit down with the mentors from ILLUME’s Mentorship Program to share their firsthand experiences,…
-

Case Studies
Strategic Planning for a Decarbonized Future
Case Studies
ILLUME assists clients by offering strategic planning support to identify research, program designs, and technologies that align with utility…
-

Presentations
NECC: Inclusive Energy Codes
Presentations
In this talk given at the National Energy Codes Conference (NECC) 2024, Bahareh van Boekhold talks about Inclusive Energy…


THE WORK WE DO
Areas of Expertise
As energy specialists, ILLUME empowers utilities, regulators, and industry leaders to tackle complex challenges and accelerate innovation in the power sector. Through our data-driven, experience-informed consulting, we help you develop strategies that endure administrative, technological, and market shifts.